Having the ability to accurately measure your brand’s share of wallet can be a huge asset in optimising your marketing and promotional strategies.
Share of wallet is the amount an individual customer spends with your brand compared to the amount they spend across the rest of your category. Unlike market share—which is the percentage of customers or revenue your brand controls in your category, share of wallet changes from individual to individual.
While market share is an indicator of brand performance, share of wallet is a critical tool for understanding how people are spending in your category and using those insights to encourage customers to increase their spend with you.

Why measure share of wallet?
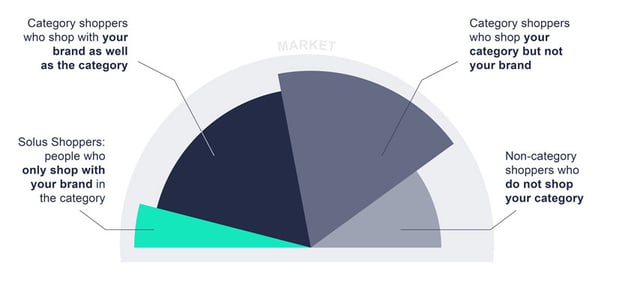
Within a category there exists four main customer groups: Solus Shoppers, Category Shoppers who shop your brand, Category Shoppers who do not shop your brand and Non-category Shoppers.
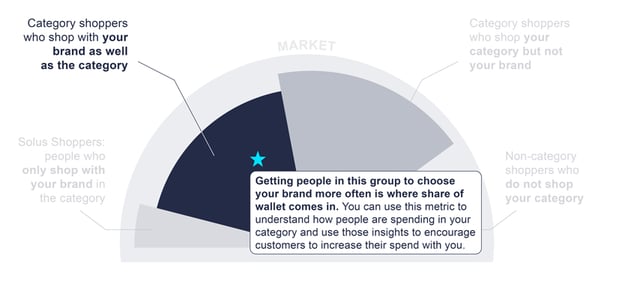
Share of wallet applies to the Category Shoppers who shop your brand. Getting these shoppers to choose your brand more often is where share of wallet comes in. With this metric you can understand how much of your shoppers’ spend goes to you and how much goes to a competitor at an individual shopper level. From here, you can layer how much they spend per visit and how often they shop in your category, which will reveal whether customers shop more or less frequently with you versus your competitors as well as and weather they spend more or less per visit with you versus your competitors. With these insights, you can then formulate strategies to encourage increased spend with your brand.
It’s easy to think of share of wallet as just another customer experience metric but it’s more than that. While metrics such as Net Promoter Score and customer effort assess customers’ perceived levels of effort and advocacy levels, share of wallet assesses customer loyalty and purchase habits. It’s a performance metric, not a perceptual metric. Effort and NPS can help explain why your share of wallet is low or high.
For example, you might consider a customer who buys from you once a week a loyal customer. However, examining that customer’s share of wallet might find they actually buy three times a week from your other competitors. For that customer, purchasing from your category is a habit rather than loyalty to a particular brand.
Moreover, share of wallet can reveal who your main competitors are. Say you operate in a category with three other competitors, let’s call them A, B and C. While Competitor A might have the largest market share in your category, your customers’ share of wallet might show that they mainly shop with you and Competitors B and C, and not Competitor A at all. That could be for a variety of reasons, such as location, price, product range, and/or brand preference.
Read more: 4 reasons to build transactional data into your business
Driving performance with share of wallet
Knowing your share of wallet also acts as a springboard to understanding the metrics and customer behaviours that drive it, such as visit frequency or spend per visit. Is your share of wallet low because your customers only visit your brand once every five visits in your category? Or is it low because they spend less each visit with you compared to your competitors?
Also consider:
- How your customers’ share of wallet varies at key times of the day, week, month and year (such as breakfast/lunch/morning/afternoon, weekend/weekdays and Christmas/Black Friday/Cyber Monday/long weekends).
- How your customers’ share of wallet varies day to day.
With this understanding, you can then formulate strategies to encourage the habits that will grow your share of wallet. For example, to boost visit frequency during certain times of the week you might run a limited-time offer promotion. To encourage customers to spend more with you, you might create a ‘buy one, get the second half price’ deal or introduce a more premium offering.
Assessing the impact of your strategy
Ideally, you want at least one customer data source that shows share of wallet rather than relying solely on self-reported behaviour. Transactional data, for example, can help you close the loop on how your strategies are influencing share of wallet by revealing:
- Overall share of wallet changes over time (yours and your competitors).
- The loyalty dynamics within your brand and category (i.e. loyal customers, or switching brands within your market).
- Purchase behaviours to determine how your media is influencing your share of wallet.
- Geographical nuances in your share of wallet to inform your regional strategies.
- Time-specific spending behaviour to understand how your promotions are impacting your share of wallet on a weekday/weekend/weekly/monthly basis.
Read more: The power of claimed versus actual behaviour
To add to this, regular follow-up surveys can further help understand exactly what purchase habits and loyalty behaviours you have succeeded in engraining (and why) as well as the areas where you need to keep working.
To succeed in today’s market, businesses need to look outward as well as inward—and share of wallet plays a critical role in this. With it, you can understand what your customers are doing outside of your door, from where else they are visiting to who else are they buying from both inside and outside your category. If you limit your insights to inward navel gazing, you are left with a narrow view on who your most loyal customers are and where you can achieve growth from.
Want to learn how transactional data can enhance your brand and marketing decisions? Download a copy of our free transactional data guide.